Civic tech2026
Win El Dhaw
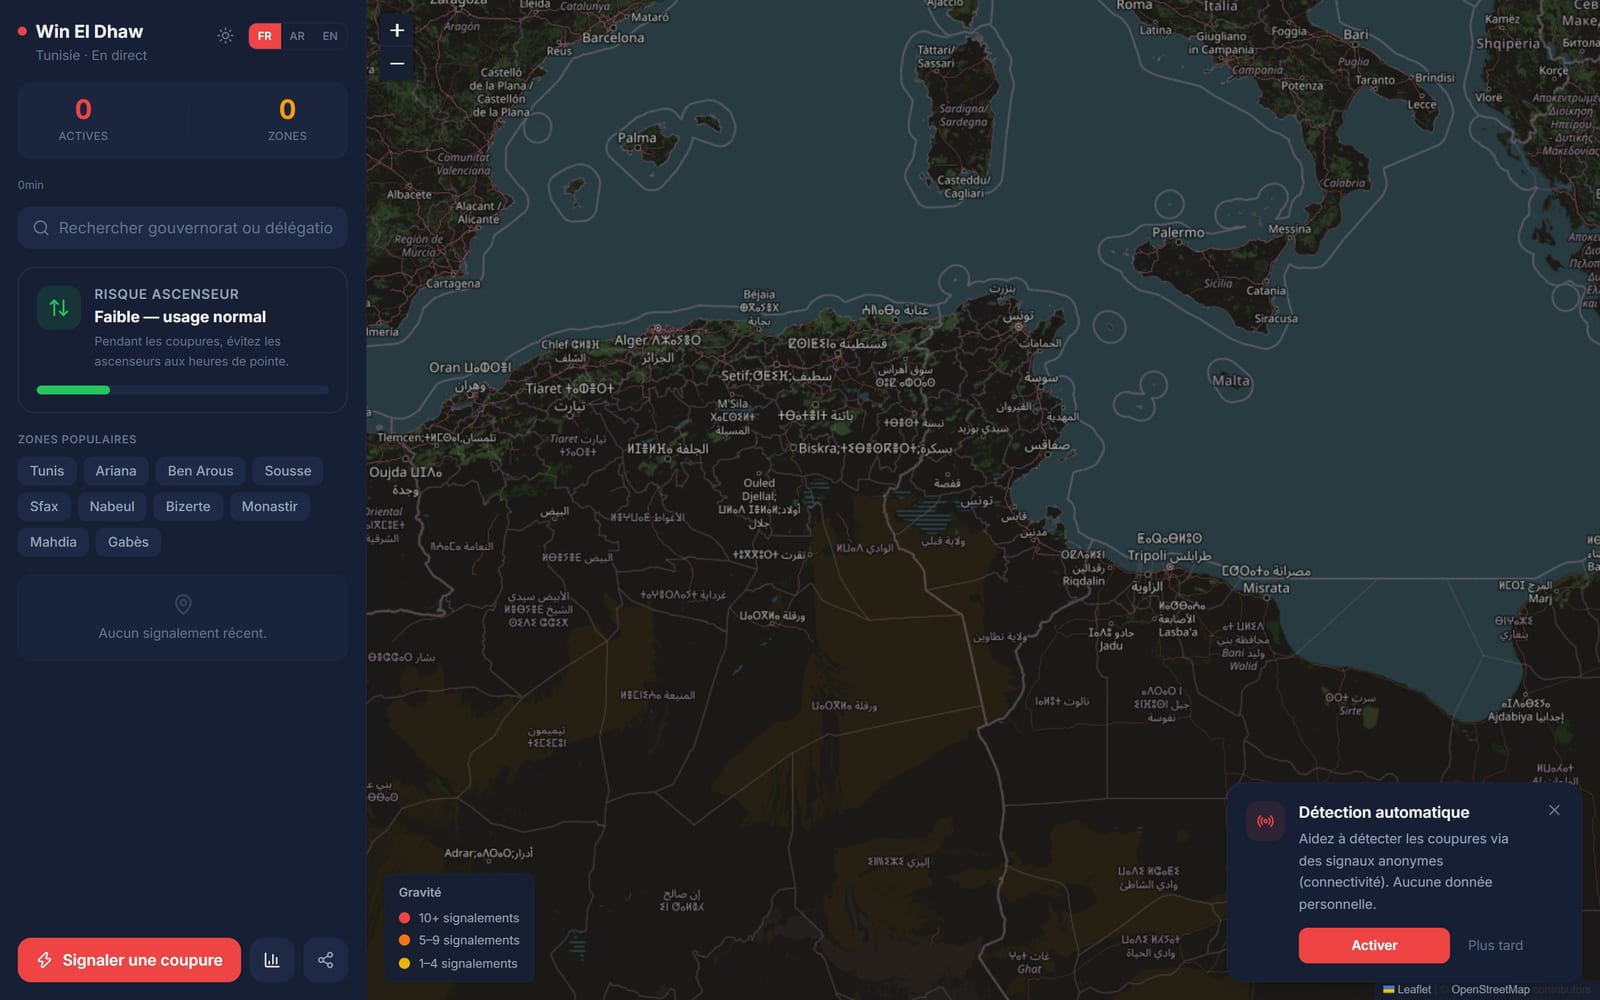
A live map of power cuts in Tunisia, inferred from phones that go quiet.
- Role
- Solo: product and engineering
- Year
- 2026
- Stack
- Next.js, Supabase, PostGIS, Realtime, Leaflet, Telegram bot, Python
3
silent phones before a cut is called
The problem
When the power goes out in Tunisia, people find out where and for how long through Facebook posts and word of mouth. There's no shared, live picture.
What I built
- One map that merges reports from the web app, a Telegram bot and a news scraper that runs every 30 minutes.
- Reports are clustered server-side into outage zones with PostGIS DBSCAN, across 24 governorates and 264 delegations.
- Passive detection: opted-in devices send an anonymous heartbeat every 4 minutes.
- An elevator-risk card at peak hours, and the whole interface in Arabic, French and English.
How it earns trust
Silence, confirmed by neighbours
A power cut is inferred only when at least 3 devices within about 1.5 km stop reporting for more than 10 minutes. One phone with a dead battery proves nothing.
The crowd checks the crowd
Every outage zone carries confirm and dispute counters, so a false report is visible as one.
Several independent sources
User reports, the Telegram bot and published news are merged, so no single source decides what the map shows.
Anonymous by default
Devices use anonymous IDs with rate limits. Nothing personal is collected to detect a cut.
By the numbers
- devices needed to infer a cut
- 3devices needed to infer a cut
- heartbeat interval
- 4 minheartbeat interval
- delegations covered
- 264delegations covered
- news scraper cycle
- 30 minnews scraper cycle
How it fits together
- Web reportsinsertSupabase
- Telegram botwebhookSupabase
- News scrapercron, every 30 minSupabase
- Device heartbeatsevery 4 minSupabase
- SupabasePostGIS DBSCANOutage zones
- Outage zonesRealtimeLive map
What I'd do next
Publish an outage history per delegation, so the map becomes evidence as well as a live view.